
Your current OEE score is a vanity metric that masks significant financial loss; true profitability is only unlocked by moving beyond averages and obsessively tracking granular, real-time performance deviations.
- Manual operator logs systematically inflate performance by ignoring « unreportable » micro-stops and rounding errors, creating a dangerously false sense of security.
- Focusing on major downtime (Availability) while ignoring incremental speed and quality losses (Performance) is the single biggest strategic error in food and beverage manufacturing.
Recommendation: Implement automated, sensor-based tracking to establish algorithmic honesty, expose true capacity leakage, and shift focus from high-level OEE scores to actionable, real-time profit metrics.
As a Production Director in the UK food sector, you operate under a state of permanent siege. Supermarket buyers demand lower unit costs, while volatile supply chains and rising energy prices erode margins. In this environment, Overall Equipment Effectiveness (OEE) has been positioned as the definitive key performance indicator—a single number to measure the health of your manufacturing operation. The industry has adopted it widely; in fact, research shows that 75% of food manufacturers now measure OEE, significantly more than in other sectors.
Yet, this widespread adoption has bred a dangerous complacency. The standard calculation, often based on flawed data, produces a comforting but ultimately misleading metric. It tells you a score, but it fails to quantify the true cost of inefficiency. But what if the relentless focus on a single OEE percentage was the very thing preventing you from uncovering the double-digit capacity gains hidden within your existing assets? What if the key wasn’t just measuring OEE, but fundamentally distrusting how it’s calculated?
This analysis is not about the basics of OEE. It is a forensic examination of the hidden losses that conventional tracking methods encourage you to ignore. We will dissect the systemic flaws in manual data collection, expose the catastrophic financial impact of « minor » performance deviations, and provide a rigorous, data-driven framework for transitioning from vanity metrics to true profit metrics.
This article provides an analytical breakdown of the core OEE components, exposing common measurement flaws and offering precise, data-driven solutions. The following sections will guide you through a systematic process for transforming your OEE from a historical report card into a real-time strategic weapon.
Contents: Maximising True Equipment Effectiveness
- Why Manual Operator Logging Inflates Your True Performance Metrics?
- How to Calculate Quality Loss Accurately During High-Speed Bottling?
- Availability vs Performance: Which Metric Requires Urgent Investment?
- The Micro-Stop Ignorance That Quietly Steals 15% of Daily Capacity
- Fixing Sub-Optimal Machine Speeds Using Automated Threshold Alerts
- The Optimal Frequency for Conducting Value Stream Mapping Sessions
- Why Run-to-Failure Strategies Cost Three Times More Than Algorithmic Prevention?
- Implementing Algorithmic Fault Detection for Heavy Manufacturing Equipment
Why Manual Operator Logging Inflates Your True Performance Metrics?
The foundational weakness of most OEE programmes is their reliance on manual operator logs. This methodology is not just imprecise; it is systematically biased towards over-reporting performance. Operators, under pressure to meet targets and minimise administrative burden, will naturally round-off times, amalgamate small stops into larger, more « acceptable » categories, or fail to log brief interruptions altogether. This isn’t a failure of personnel; it is an inevitable outcome of a flawed system. The result is a distorted view of reality—an OEE score that looks healthy on a spreadsheet but fails to reflect the genuine output of the line.
This gap between reported and actual performance is not trivial. It is where profit leaks out of the business unnoticed. Real-time, automated monitoring provides the antidote. By removing human subjectivity, it generates a dataset of « algorithmic honesty. » For instance, a cosmetics plant that transitioned to automated tracking achieved a 22% improvement in OEE simply by gaining real-time visibility into line status. The team could see and eliminate downtime as it happened, rather than debating it at the end of a shift based on inaccurate notes.
To quantify the inaccuracy of your current system, a rigorous audit is non-negotiable. Your objective is to prove the financial cost of this « data gap » and build the business case for automated tracking. A systematic comparison of logged downtime against actual production deficits will reveal the scale of the problem and provide an undeniable baseline for improvement.
Action Plan: Auditing Manual Logging Inaccuracies
- Points of Contact: List all points where data is manually recorded—operator log sheets, shift handover notes, and whiteboard entries.
- Collecte: For a defined period (e.g., one week), collect all existing paper-based records and parallel production output data (e.g., total units produced vs. theoretical maximum).
- Cohérence: Cross-reference operator-logged downtime reasons and durations with the actual production deficit. Identify discrepancies and patterns in « rounding » behaviours, particularly at shift changes.
- Mémorabilité/émotion: Document variations in logging detail between different operators on the same equipment. Pinpoint where vague entries like « minor stop » are used to mask multiple, specific issues.
- Plan d’intégration: Quantify the total « unaccounted for » time and translate it into lost units and revenue. This becomes the financial justification for implementing parallel digital tracking to establish an accurate baseline.
How to Calculate Quality Loss Accurately During High-Speed Bottling?
In high-speed operations like bottling, quality losses are often the most difficult component of OEE to measure accurately. While catastrophic failures (e.g., a batch of incorrect liquid) are obvious, the more insidious losses come from minor, often intermittent, defects: underfills, misaligned labels, cap-sealing errors, or cosmetic imperfections. These « death by a thousand cuts » issues are frequently absorbed into general scrap rates or rework loops, their true impact on capacity and cost-per-unit remaining unquantified. The first step towards control is rigorous and granular categorisation.
Calculating the Quality component of OEE requires a simple formula: (Good Units / Total Units Produced). The challenge lies in defining « Good Units » with absolute precision. This requires moving beyond a binary pass/fail mentality. A unit that requires rework, for example, is not a « good unit » in its first pass; it has consumed machine time, labour, and energy twice. Therefore, First Pass Yield (FPY) is the only truly honest measure of initial quality performance. Every unit that is not perfect the first time represents a quality loss and must be tracked as such.
Automated inspection systems are critical here. Relying on manual spot-checks on a line producing hundreds of bottles per minute is statistically insignificant. Vision systems, checkweighers, and torque analysers provide a continuous stream of data, enabling you to pinpoint the exact moment quality deviates. This allows for immediate root cause analysis—is it a specific filling head, a worn part on the labeller, or a variation in raw materials? Without this level of detail, you are merely documenting failure, not preventing it.

The table below breaks down the key quality factors. Your measurement system must be able to differentiate between these loss types to enable targeted improvement. Lumping them all into « scrap » obscures the path to a solution. For instance, a high rework rate points to a correctable process issue, whereas a high scrap rate might indicate a fundamental material or machine design flaw.
This table breaks down the crucial quality metrics that must be isolated and tracked to calculate a true quality score. Lumping them together as ‘defects’ is insufficient for targeted action.
| Quality Factor | Impact on OEE | Measurement Method |
|---|---|---|
| First Pass Yield | Direct quality score component | Good parts / Total parts produced |
| Rework Rate | Reduces effective quality % | Rework parts / Total production |
| Scrap Rate | Direct quality loss | Scrapped units / Total units |
| Customer Returns | Post-production quality impact | Returns / Shipped units |
Availability vs Performance: Which Metric Requires Urgent Investment?
The traditional OEE framework gives equal weight to its three components: Availability, Performance, and Quality. However, strategic focus and investment must be allocated based on the specific context of your operation. In the food and beverage sector, a distinct pattern emerges. As one manufacturing analytics expert notes, the industry’s focus is often narrowly fixed on major stoppages. Worximity Manufacturing Analytics, in their analysis « Ways to Calculate OEE in the Food and Beverage Industry », points this out clearly:
Food and beverage manufacturers tend to focus more narrowly on availability and quality as factors that will produce the most business impact. Because much of food and beverage manufacturing today uses automated machinery, the factors that contribute to performance tend to lead to lesser gains in calculated OEE.
– Worximity Manufacturing Analytics, Ways to Calculate OEE in the Food and Beverage Industry
This statement reveals a critical—and costly—misconception. The focus on Availability (major downtime) is understandable; a stopped line is a highly visible problem. However, the assumption that Performance yields « lesser gains » is only true when its losses are poorly measured. The aggregate impact of running slightly below ideal cycle time, or of constant micro-stops, is often far greater than the impact of a few major breakdowns. Yet, because these losses are less dramatic, they are ignored. This is the primary reason why industry data reveals that the food and beverage sector lags with an average OEE of 53%, compared to over 65% in other industries.
The decision of where to invest—in a new machine to improve Availability or in sensors to improve Performance—must be data-driven. The question is not « Which is more important? » but « Where is my biggest source of unmonetized capacity? » If your line is running, but at 85% of its designed speed, that represents a 15% continuous loss of capacity. A major breakdown, while disruptive, might only account for a 5% loss when averaged over a year. The « slow bleed » of performance loss is almost always a larger and more addressable opportunity than the « hemorrhage » of a major stoppage.
Therefore, the urgent investment is required in the systems that allow you to see Performance losses with the same clarity as Availability losses. This means sensors to track cycle time in real-time, to automatically log micro-stops, and to alert supervisors the moment a machine deviates from its optimal running speed. Only then can you make a financially sound decision about where to focus your engineering and capital resources.
The Micro-Stop Ignorance That Quietly Steals 15% of Daily Capacity
Micro-stops are the silent killer of OEE. These brief interruptions—typically under five minutes and often lasting only seconds—are the most frequently ignored of the Six Big Losses. Clearing a jammed bag, refilling a label roll, or wiping a sensor are seen as « just part of the job. » Operators rarely log them because the effort of logging exceeds the duration of the stop itself. Consequently, they evaporate from the data, never appearing on a downtime report. Yet, their cumulative impact is staggering. A line experiencing just 10 six-second micro-stops per hour loses an entire minute of production time. Over a 24-hour period, that’s nearly half an hour of capacity that has simply vanished without a trace.
It’s not uncommon for meticulous tracking to reveal that the sum of these « insignificant » interruptions accounts for a 10-20% loss in daily capacity. These are losses your manual logging system is explicitly designed to hide from you. The phenomenon is well-documented; micro-stoppages, which seem like trivial brief interruptions such as clearing a jammed product or refilling a component, can accumulate into substantial productivity losses when they are tracked with digital precision. This isn’t theoretical; it’s a measurable drain on your profitability.
The solution is to remove human judgment from the equation. Automated tracking via sensors is the only way to capture this data reliably. By setting a low threshold (e.g., any stop longer than 2 seconds), you can begin to build a true picture of line stability. The goal is not to punish operators for these short stops but to aggregate the data to reveal patterns. Is a specific conveyor guide causing frequent jams? Does one packaging machine require far more frequent reloads than its identical counterpart? This data transforms the problem from an untracked annoyance into a solvable engineering challenge.
Tackling micro-stops delivers a dual benefit. Firstly, it directly recovers lost production time, increasing the Performance component of your OEE. Secondly, and perhaps more importantly, a high frequency of micro-stops is often a leading indicator of a more serious impending failure. A machine that needs constant minor adjustments is a machine under stress. By addressing the root cause of the micro-stops, you are often simultaneously conducting preventative maintenance, improving both Performance and future Availability.
Fixing Sub-Optimal Machine Speeds Using Automated Threshold Alerts
The second major component of Performance loss is reduced speed. This loss is even more insidious than micro-stops because the machine is still running and producing product, creating the illusion of efficiency. A machine designed to run at 100 units per minute but consistently operated at 90 units per minute is experiencing a 10% performance loss. Over an eight-hour shift, this equates to 4,800 lost units of production. This is not a hypothetical; it is a direct and quantifiable loss of revenue hidden in plain sight.
This loss is typically driven by one of two factors: either an operator intentionally slows the machine to increase stability and avoid a difficult-to-manage jam, or the machine’s optimal settings have been lost over time through various minor adjustments. In either case, the result is a « new normal » where the sub-optimal speed becomes the accepted standard. Without a system to flag this deviation, the performance loss becomes institutionalised and invisible.
Automated threshold alerts are the only effective countermeasure. By connecting a machine’s PLC to a monitoring system, you can establish the Ideal Cycle Time as a non-negotiable benchmark. The system can then be configured to trigger automated alerts when performance deviates from this standard. This is not about micro-management; it is about providing operators and supervisors with the real-time data needed to maintain peak efficiency. This moves the conversation from « How did the shift go? » to « Why were we running at -5% of target speed between 10:15 and 10:45? »
The configuration of these alerts is a strategic decision, designed to prompt the right response at the right level. A minor deviation might trigger a local alert for the operator, while a sustained or critical slowdown should automatically escalate to engineering or management. The table below outlines a standard, effective alert strategy.
This table provides a logical framework for configuring automated alerts to combat speed loss, ensuring the right level of response for the severity of the deviation.
| Alert Type | Threshold Setting | Response Time |
|---|---|---|
| Speed Deviation | -5% from ideal rate | Immediate operator alert |
| Sustained Slowdown | -10% for 5+ minutes | Supervisor escalation |
| Critical Performance Loss | -15% or complete stop | Engineer notification |
The Optimal Frequency for Conducting Value Stream Mapping Sessions
Value Stream Mapping (VSM) is a cornerstone of lean manufacturing, providing a holistic view of the material and information flow required to bring a product to a customer. However, it is often treated as a one-time project—a comprehensive map is created, improvements are identified, and the resulting document is filed away. This is a fundamental misuse of a powerful tool. In a high-pressure environment, the value stream is not static; it is constantly changing. The optimal frequency for VSM is therefore not determined by a calendar, but by data-driven triggers.
An annual VSM review is insufficient. Your primary trigger should be the OEE data itself. A sustained negative trend in OEE over a period of two to three weeks is a clear signal that a constraint has emerged or a previous improvement has failed. This should automatically trigger a focused VSM session, not for the entire plant, but for the specific process or equipment exhibiting the performance degradation. This transforms VSM from a large-scale annual event into a targeted, agile diagnostic tool.
Other non-negotiable triggers for a VSM review include:
- Major equipment changes: The introduction of a new machine or a significant overhaul of an existing one alters the capacity and flow of the entire line. A VSM is required to re-balance the system.
- Changes in customer requirements: A shift in packaging, order size, or delivery frequency demanded by a major supermarket can create new bottlenecks upstream. The value stream must be re-mapped to accommodate this.
- Supply chain disruptions: A change in raw material supplier or component availability can have ripple effects throughout production. VSM helps to identify and mitigate these impacts proactively.
The goal is to maintain a « living » value stream map that reflects the current reality of your operation. This approach moves VSM from the strategic planning department onto the shop floor, making it a real-time tool for continuous improvement. The ultimate objective is to push your OEE towards world-class levels. While the food and beverage industry average is low, industry benchmarks indicate that an OEE score of 85% is considered world-class for discrete manufacturers. This gap between the average and the benchmark represents a massive opportunity, and dynamic VSM is the roadmap to closing it.
Why Run-to-Failure Strategies Cost Three Times More Than Algorithmic Prevention?
A « run-to-failure » maintenance strategy, while seemingly the cheapest option in the short term, is catastrophically expensive in reality. It is a reactive approach that cedes control of your production schedule to the random failure of equipment. The total cost of an unplanned failure is not just the price of the replacement part and the maintenance technician’s time. The true cost is a multiple of this, encompassing lost production, potential secondary damage to adjacent components, overtime pay to catch up, and the risk of failing to meet a customer delivery deadline. A conservative estimate places the true cost of unplanned downtime at least three times that of a planned, scheduled repair.
Algorithmic prevention, or predictive maintenance (PdM), represents a fundamental shift from reaction to control. By deploying sensors to monitor key equipment parameters—such as vibration, temperature, and power consumption—it is possible to detect the faint signals of an impending failure long before it becomes catastrophic. Advanced algorithms analyse this data stream, comparing it to baseline performance and known failure patterns to predict when a component is likely to fail. This is a game-changer. For example, a snack foods manufacturer with aging equipment reduced its unscheduled downtime by 30% and increased machinery reliability by 12% by implementing predictive analytics.
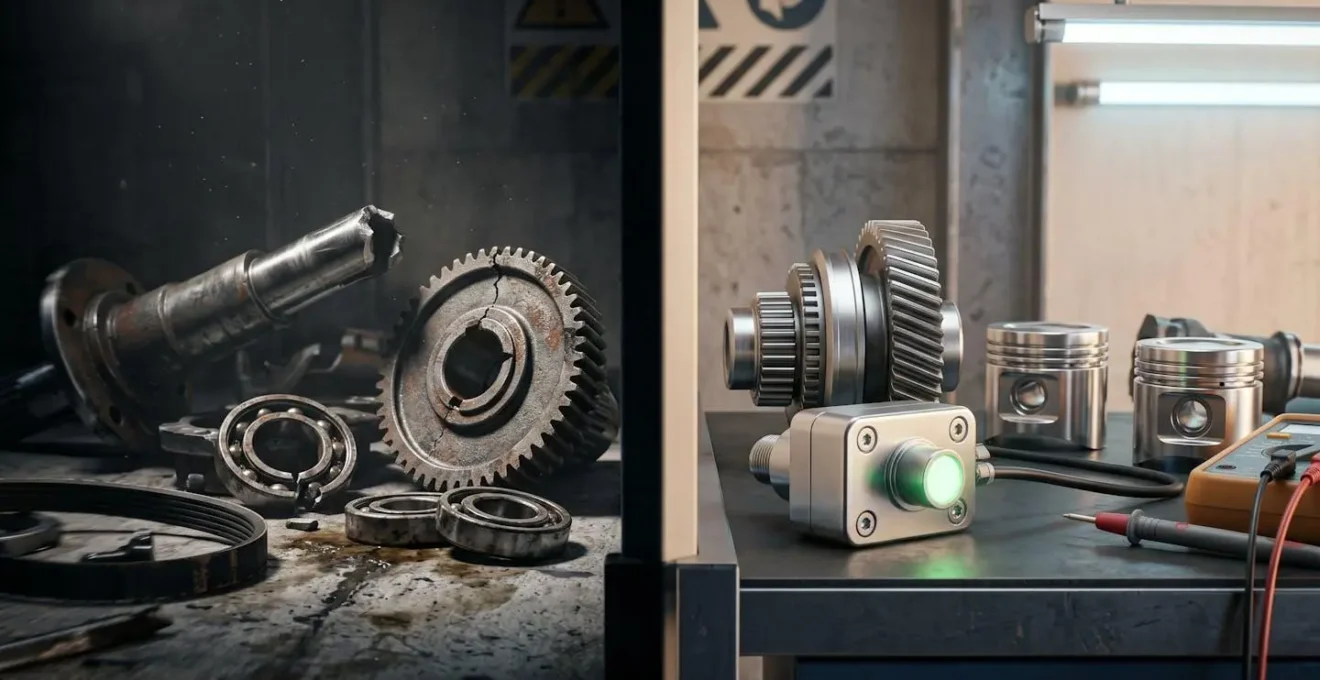
This allows maintenance to be scheduled at the most economically opportune time, such as during a planned changeover, minimising the impact on production. The results of this approach are dramatic and well-documented. Implementing these systems is not a cost centre; it is a profit-maximisation strategy. Data consistently shows that predictive maintenance systems achieve up to a 40% reduction in unplanned downtime within the first year of operation. This is a direct and significant boost to the Availability component of OEE and, more importantly, to the bottom line.
The transition from a reactive to a predictive maintenance culture requires an investment in both technology and mindset. It demands a belief that data, not experience or intuition alone, is the most reliable guide to maintaining equipment health. The financial return on this investment, however, is not in question. It is one of the most direct routes to unlocking the hidden capacity within your factory.
Key Takeaways
- Your current OEE is likely inflated by biased manual logging; only automated data capture reveals the true, lower baseline from which to improve.
- The cumulative impact of « minor » performance losses (micro-stops and reduced speed) is almost always greater than the impact of major, visible downtime.
- Predictive maintenance driven by algorithmic analysis is not a cost but an investment, proven to be at least three times more cost-effective than a run-to-failure strategy.
Implementing Algorithmic Fault Detection for Heavy Manufacturing Equipment
The final and most powerful stage in maximising equipment effectiveness is the full implementation of an algorithmic fault detection system. This moves beyond simply tracking OEE to proactively preventing the losses that degrade it. For heavy, critical manufacturing equipment—mixers, ovens, packaging lines—this is not an optional luxury but a competitive necessity. The strategic decision is not *if* but *how* to implement such a system, as the approach chosen will have significant implications for capital expenditure, scalability, and time-to-value.
The implementation models fall into three main categories. A cloud-based Software-as-a-Service (SaaS) model offers the lowest initial investment and fastest deployment, making it ideal for organisations seeking rapid proof-of-concept and high scalability. A traditional on-premise solution requires significant upfront capital expenditure (CAPEX) for servers and infrastructure but offers greater control over data security and customisation. A hybrid approach seeks to balance these factors, keeping critical control systems on-premise while leveraging the cloud for heavy data analysis and storage.
Choosing the correct model depends on your organisation’s existing IT infrastructure, capital budget, and risk tolerance. However, regardless of the model, the core functionality remains the same: to use real-time sensor data and historical trends to automatically identify deviations that signal an impending fault. This is the culmination of the principles discussed: it provides the algorithmic honesty to overcome manual logging bias, the granularity to track micro-stops and speed loss, and the foresight to eliminate unplanned downtime.
The following table provides a high-level comparison to guide this critical strategic decision. Production Directors must weigh the initial investment and deployment time against the long-term flexibility and total cost of ownership.
This comparison table outlines the key strategic trade-offs between different implementation models for a fault detection system, a critical decision for any plant manager.
| Implementation Model | Initial Investment | Time to Deploy | Scalability |
|---|---|---|---|
| Cloud-based SaaS | Low (subscription) | 2-4 weeks | High flexibility |
| On-premise solution | High (CAPEX) | 3-6 months | Limited by infrastructure |
| Hybrid approach | Medium | 6-8 weeks | Balanced |
The journey from a vanity OEE metric to a powerful profit driver is a systematic process of exposing and eliminating hidden losses. It requires a cultural shift from accepting averages to obsessing over deviations. Begin today by initiating an audit of your manual logging process to quantify the gap between perception and reality. This data will be the lever that justifies the investment in the automated systems required to compete and win.